Posts

Showing posts from 2024

HTML Renderer (Emacs)

Image
  Emacs: A non-intrusive browser An Elisp implementation of HTML rendering using SVG. The browser functionality is an extension of eww . For Javascript, you can use either NodeJS or QuickJS as a JS interpreter . Developer Note: The entry point is shr-render.   Table Colspan example Rowspan example Sample Table <html>   <body>     <table border="1">       <tr bgcolor="#9acd32">         <th style="text-align:left">Title</th>         <th style="text-align:left">Artist</th>       </tr>       <tr>         <td>Empire Burlesque</td>         <td>Bob Dylan</td>       </tr>     </table>   </body> </html...

The Oval Editor (Emacs)

Image
   The Oval Editor is a feature which allows the user to combine text with advanced formatting and drawings seamlessly in Emacs. This is an amalgamation of several disparate features developed over a period of time . It is also available as a single package in my Emacs fork . Draw and Scribble Notes in GNU Emacs   Text inside a shape (uses librsvg fork ) Context menu   Variable fonts Faux Bold and Italics   Annotate Completion Candidates   Text wrap at fixed pixel width in edit mode (only available in my Emacs fork) Symbol selector     (require 'formula)    Use M-x formula-draw to start drawing in a buffer. Select rectangle shape by pressing r. You can use the grid lines to align the shapes. You may exit the drawing mode by pressing q. Double-click on the shape to start editing the text inside a shape. The editing area is restricted to the width of the enclosing shape. Use right-click context menu to apply formatting. The demo use...

Variable Font in Emacs

Image
Variable fonts are an evolution of the OpenType font specification that enables many different variations of a typeface to be incorporated into a single file, rather than having a separate font file for every width, weight, or style. Please note that the fonts are designed for readability. These are not simple geometric transformations. Hence, the fonts may or may not support full range of variations specified by the standards. Font weight ranges from 100 to 900 for variable fonts. For static fonts, this range is between 0 to 215. You can use FcWeightToOpenTypeDouble() for converting static font weight to variable font weight. Font width ranges from 50 to 200. This is a percentage value. For example, ultra-expanded is 200% of normal width. This is same for static font. In Emacs, use :weight and :width face attributes for setting the values. cairo_font_options_set_variations() Cairo API can be used to render these variations in Emacs. Please note that the sequence of axes - wght...

Faux Bold and Italic

Image
Faux bold and italic using Freetype API   Modern Outline fonts (Truetype and Opentype) have a separate file for each weight and style for better readability. They are usually suffixed as normal, Bold, Italic and Bold-Italic. This means that one cannot render these variants if the font files are missing. From the end user perspective this is annoying at times. Following APIs can be used to generate faux bold and italic variants.   Freetype API   cairo_ft_font_face_set_synthesize (font_face, CAIRO_FT_SYNTHESIZE_BOLD                      | CAIRO_FT_SYNTHESIZE_OBLIQUE);   Cairo transformation API Use x-stretch transformation for bold and skew transformation for italic. cairo_matrix_t font_matrix;   font_matrix.xx *= 1.5; // Bold - stretch font_matrix.xy = -5;     // Italic - skew   Harfbuzz API This didn't work for me.  hb_font_set_synthetic_slant(fon...

Annotate completion candidates (GNU Emacs)

Image
GNU Emacs supports annotation for completion candidates. An annotation is a small bit of useful information shown next to a completion candidate which a package developer can use to provide additional help to the user while making a selection. e.g. while selecting a command, this is usually the keyboard shortcut. In the following example, annotation is used to display a sample text with the candidate font-family applied.  (defun test ()   (interactive)   (let* (( completion-extra-properties           `(:annotation-function         (lambda (a)           (propertize " (OIly10)" 'face               `(:family ,a :background "grey"))))))     (completing-read "Font family: " (font-family-list))     ))   By default , Emacs uses completions-annotations face for the annotation...

Text along a path (GNU Emacs)

Image
  SVG 2 specifications allows flowing text along a curve via textPath element. This opens up possibilities for cool text effects e.g. Formula Editor in GNU Emacs . GNU Emacs uses librsvg for SVG rendering on GNU/Linux. This fix for librsvg was  available in 2014 [4]. But this wasn't applied for some reason. Librsvg has moved to Rust since then. The code below is pre-Rust version of librsvg. sample.svg <?xml version="1.0" encoding="UTF-8"?> <svg height="300" width="800" xmlns="http://www.w3.org/2000/svg"      xmlns:xlink="http://www.w3.org/1999/xlink">     <path id="my_path1" d="M 50 100 Q 25 10 180 100 T 350 100 T 520 100 T 690 100" fill="transparent" />     <text>         <textPath xlink:href ="#my_path1" font-size="34"> Text along a path looks awesome!!         </textPath>     </text> </svg> ...

Context Menu is Personal (GNU Emacs)

Image
  Define custom menu based on your preferences. Note the definition of visibility conditions ( :visible keyword) and sub-menu ( More ). They are helpful in reducing the clutter. (Note: There are some placeholders in the code below.) (easy-menu-define my-menu global-map "My context menu"   '("Context Menu"     ["Cut"   kill-region :visible (region-active-p)]     ;; ["Copy"  kill-ring-save t] ;; Menu copies by default for further action     ["Paste" yank :visible (not (region-active-p))]     ["Open    " org-open-at-point t]     ["Calculate    " calc-grab-region t]     ["Execute    " (lambda () (interactive)             (shell-command-on-region (region-beginning) (region-end) "sh")) t]     ["Search Web" (lambda () (interactive) (eww (car kill-ring))) t]     ...

Alternatives in GNU Emacs - Wheel of time

Image
   Imagine you have a collection of images. Sometimes you want to view them in chronological order. However, chances are these pictures are not taken uniformly over a period of time. In other words, certain periods have more pictures than others. What kind of view can give you - A complete picture of the whole timeline for which pictures are available Time periods when you have more pictures than others An easy way to drill down into any period of interest This is wheel of time view in graph-brain . Since this is just a view and not a rigid directory structure, it allows additional conveniences. e.g. if you only have a single picture in a particular year, clicking on the year will take you directly to the picture. You don't have to navigate through month and day. Git Log Goes Spiral Git log display is mostly sequential including the branch commits. Color-coding the branches in a spiral seems handy.     Lessons Learnt On Linux, you can change the modification time of ...

Alternatives in GNU Emacs - Tag Explorer

Image
    Firefox provides the option to add tags to your bookmarks for categorization. These tags are available at this URL. chrome://browser/content/places/places.xhtml   If you want to access the same from GNU Emacs, you should backup as JSON to preserve tag information ( Import and Backup > Backup... ). The command graph-firefox-bookmarks parses this information and presents a graphical view. The command org-open-at-point opens the link in the browser. Code https://github.com/atamariya/tumblesocks/blob/dev/graph-pack.el https://github.com/atamariya/tumblesocks/blob/dev/graph-enclose.el https://github.com/atamariya/tumblesocks/blob/dev/graph-draw.el https://github.com/atamariya/tumblesocks/blob/dev/graph-brain.el    

Alternatives in GNU Emacs - File Explorer

Image
Traditionally, Operating Systems (OS) have had folders as an organization entity for collection of files. Documents, Videos, Photos and Downloads folders cover most of the use-cases. However, if you have used it for some length of time, you'll realize it is not enough. For instance, this blog post is a collection of text, images, videos and web URLs. And while working on this idea, I need all of these at my disposal. Or atleast an easy way to access all these related resources. That's when it clicked to me why some people are gung-ho about org-mode ! Often, it's better to organize files around ideas rather than file types. For a beginner, org-mode might seem daunting. I myself ignored it completely till few days back. Don't worry about learning the syntax in depth. Even if you are not using the advanced features, there's lot to be gained. Here's complete list of types of links you can store in a text file and access it using (org-open-at-point) . ( No...

Analyzing 3 Body Problem in GNU Emacs

Image
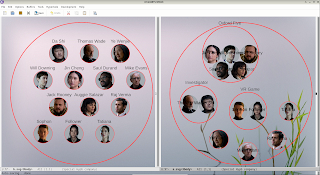
Node view (left) and Group view (right)     3 Body Problem is a sci-fi series on Netflix. Though this post is more about the analyzing process in GNU Emacs than about the show storyline. This is a work-in-progress . The entry point to the package is M-x graph-brain . Design Decisions Leaf title will be displayed at the center of the circle. If it has an image, it will be displayed at the bottom. Group title is displayed at the top. Information gets fuzzier at a certain density. Around 16 leaves and three levels - root, groups and leaves - seems to be a comfortable threshold. org-roam is being used for the database. Presently, only ID, title, filetags and  link fields are being used. IMAGE is managed as an org-mode property.   The Shape We don't want to restrict the number of characters in the story. Yet we don't want to manually decide their placement on the screen. So we need a shape which can be easily placed based on geometrical calculations. The two simplest opt...

Alternatives in GNU Emacs

Image
  Exploring some alternative ideas in GNU Emacs. Stock Heatmap Index (left) and Sector (right) performance heatmap   The circle radius is proportional to the weight of the stock in the index. The color is a range between green, white and red based on the price movement. This uses circle packing . ;; For drawing tooltip, additional point attributes are required. Properties old-x and old-y are used internally. ;; fill    - Circle color ;; title  - Circle label (Use \n for new line) ;; href - Link ;; text  - Tooltip text (Use \n for new line) (defstruct point x y r old-x old-y fill title href text)   ;; Image is an SVG image. (graph-draw-tree root image)    

Circle Packing Animation in GNU Emacs

Image
  Here's an implementation of circle packing algorithm by Wang et. el. in Elisp. Front chain is the set of circles on the periphery. These are shown as connected by red line in the animation. (require 'graph-pack) (defstruct point x y r)   ;; Define a point (setq p (make-point :x 17 :y 0 :r 16))   ;; Define a list of points (setq points (list p1 p2))   ;; Image is an SVG image. This is used for drawing the animation (optional). The return value is the front chain. This can be further used to generate a circumscribing circle. (graph-pack points image)  ;; Get circumscribing circle (setq p (graph-enclose (graph-pack children)))   Bubble Graph   You can pass a hierarchical tree of points to generate a bubble graph. Only radii of leaf nodes are mandatory. title and fill parameters are used if provided. ;; For drawing additional point attributes are required. Hence this definition is different from above. Properties old-x and old-y are used internally. (de...

SVG Animation in GNU Emacs

Image
  Synchronized Multimedia Integration Language (SMIL) is an SVG extension which allows one to create simple animation without Javascript. Here is a basic implementation for <animate> tag. (require 'svg)   (svg-animation-run)    ;; Exiting the image-mode will cancel the animation.  ;; Following command will also cancel the animation. (svg-animation-cancel)   Code https://gitlab.com/atamariya/emacs/-/blob/dev/lisp/svg.el   References Bat SVG    

Mozilla Readability in GNU Emacs

Image
  Output using Readability (left) and original eww (right)   Mozilla Readability is a standalone version of the readability library used for Firefox Reader View . A simple hack to eww can bring the same feature in GNU Emacs. ( Note: eww already has a readable mode. This is just an alternative. Updated the post to reflect the same.)   - Install NodeJS   - Install npm modules. npm install @mozilla/readability jsdom   - Create a file readability.js with following content. Note the file location. var { Readability } = require('@mozilla/readability'); var { JSDOM } = require('jsdom'); var fs = require("fs"); var str = fs.readFileSync(process.stdin.fd).toString(); var doc = new JSDOM(str); var reader = new Readability(doc.window.document); var article = reader.parse(); console.log(article.content);     - Modify the following function to use the file location noted above . Evaluate the function. (defun mozilla-readability (start end)   (shell-command-o...

Elisp Snippets

Image
Some useful Elisp snippets. Random number Generate a random number between min and  max positive integers.  Note: We are adding 1 to max to make it an inclusive range. (defun random-num (max &optional min)   (let* ((num (random ( 1+ max ))))     (if min (max min num) num)))     Random color   (defun random-color-rgb ()   (list (random 256) (random 256) (random 256))) (defun random-color-html ()   (apply #'format "#%02x%02x%02x" (random-color-rgb)))   Random face color Generate a random valid color for a font face. (defun random-color-face ()   (let* ((colors (defined-colors))      (n (length colors)))     (nth (random n) colors)))     HTML Text HTML uses HTML entities for special characters. e.g. &amp; entity for & (ampersand). ;; Buffer text to HTML Text (xml-escape-string STRING)   ;; HTML Text to buffer text (xml-substitute-special STRING)     Sym...

Data Visualization with GNU Emacs

Image
    GNU Emacs can be used for quick data visualization in combination with Gnuplot. When you have some data and you want to visualize what the correlation looks like, this command comes in handy. No need for any setup - no data file and no Gnuplot script. The command below uses some sensible defaults for trivial cases. If the first line contains string label, the same is used as a key label for the value and/or axes' names as appropriate. If there's a single column of data, it is used as Y value. If there's more than one column, first column is used as X value and other columns are plotted along Y-axis. Takes care of comma or whitespace separator. Note: The latest version of the code is available at the end of the post. Options available in latest version   - Install gnuplot executable and gnuplot Elisp package . - Evaluate the defun ( C-M-x ). - Select a data range using rectangle command copy-rectangle-as-kill (C-x r M-w). - Run M-x  gnuplot-rectangle. This open...